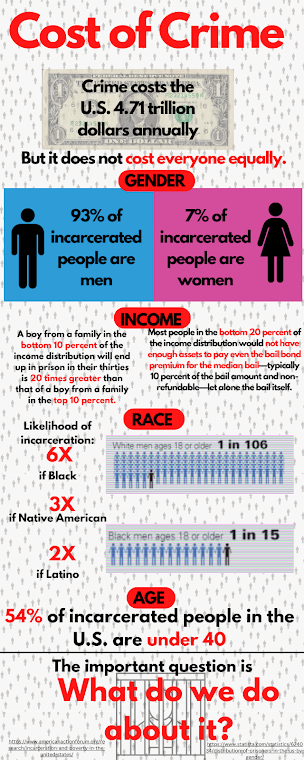
Blog Post 4: Visualization

How did you select the images and digital platform for your project? First, I spent some time thinking about what I wanted to portray and how I wanted to portray it. I knew the disproportionate statistics of incarceration were something striking, but I was trying to think of how to make the project about the cost of crime since that was my focus. I knew an infographic or video would be my method (video largely just due to my experience), but decided on an infographic since I don’t think moving image work is best for analytic display but more emotional display. I settled on an infographic as a way of portraying bold numbers and cutting statistics. I thought an interesting idea would be to contrast the dollar cost of crime to the social cost of crime. I wanted the main form of visual imagery to be numbers and human bodies, or at least renditions of humans. In the infographic, you’ll notice the dominance of the human form with a series of numerical values depictin...
